Air Quality Index: What is it and how does it work?
This article explores the Air Quality Index (AQI), including its calculation, the pros and cons, and innovative approaches to enhancing data precision.
Scott Sutton - 24 May 2023
Overview
Air pollution is a major concern for public health, and the air we breathe can significantly impact our well-being. In recent years, there has been a growing awareness of the importance of air quality and the need to monitor and manage it effectively.
One of the tools used to assess air quality is the Air Quality Index (AQI), which provides a numerical score representing the air pollution level in a given location. In this blog, we will look closer at the AQI, how it works and why it is important.
What is an Air Quality Index (AQI)?
The Air Quality Index (AQI) is a measure of air quality used to provide information about the level of air pollution in a particular area. Originally the AQI was developed in the United States in the 1960s to provide information to the public about the air quality they were breathing.
Since then, the AQI has been adopted by many other countries, including the UK, where it is managed by the Department for Environment, Food and Rural Affairs (DEFRA). Governments, businesses and individuals can use this platform to monitor air quality and identify pollution hotspots where levels of air pollution are particularly high.
How is the Air Quality Index calculated in the UK?
The AQI is calculated using data from air quality monitoring stations located in towns and cities across the UK. These stations use a range of instruments to measure the concentration of pollutants in the air, including particulate matter, nitrogen oxides, sulphur dioxide and ozone. The measurements are taken every hour, and the data is used to calculate an hourly AQI score for each location.
There are only 450 air quality reference stations in the UK, meaning air quality is calculated from only one point of location on average in each town and city. However, there is a solution to improve the precision of the AQI, leveraging hyperlocal air quality monitors.
Using real-time monitors to collect localised data on the air, street by street, enhances the ability to provide a more precise measurement of air quality. This solution can also benefit private businesses by allowing them to monitor the air quality in their immediate vicinity.
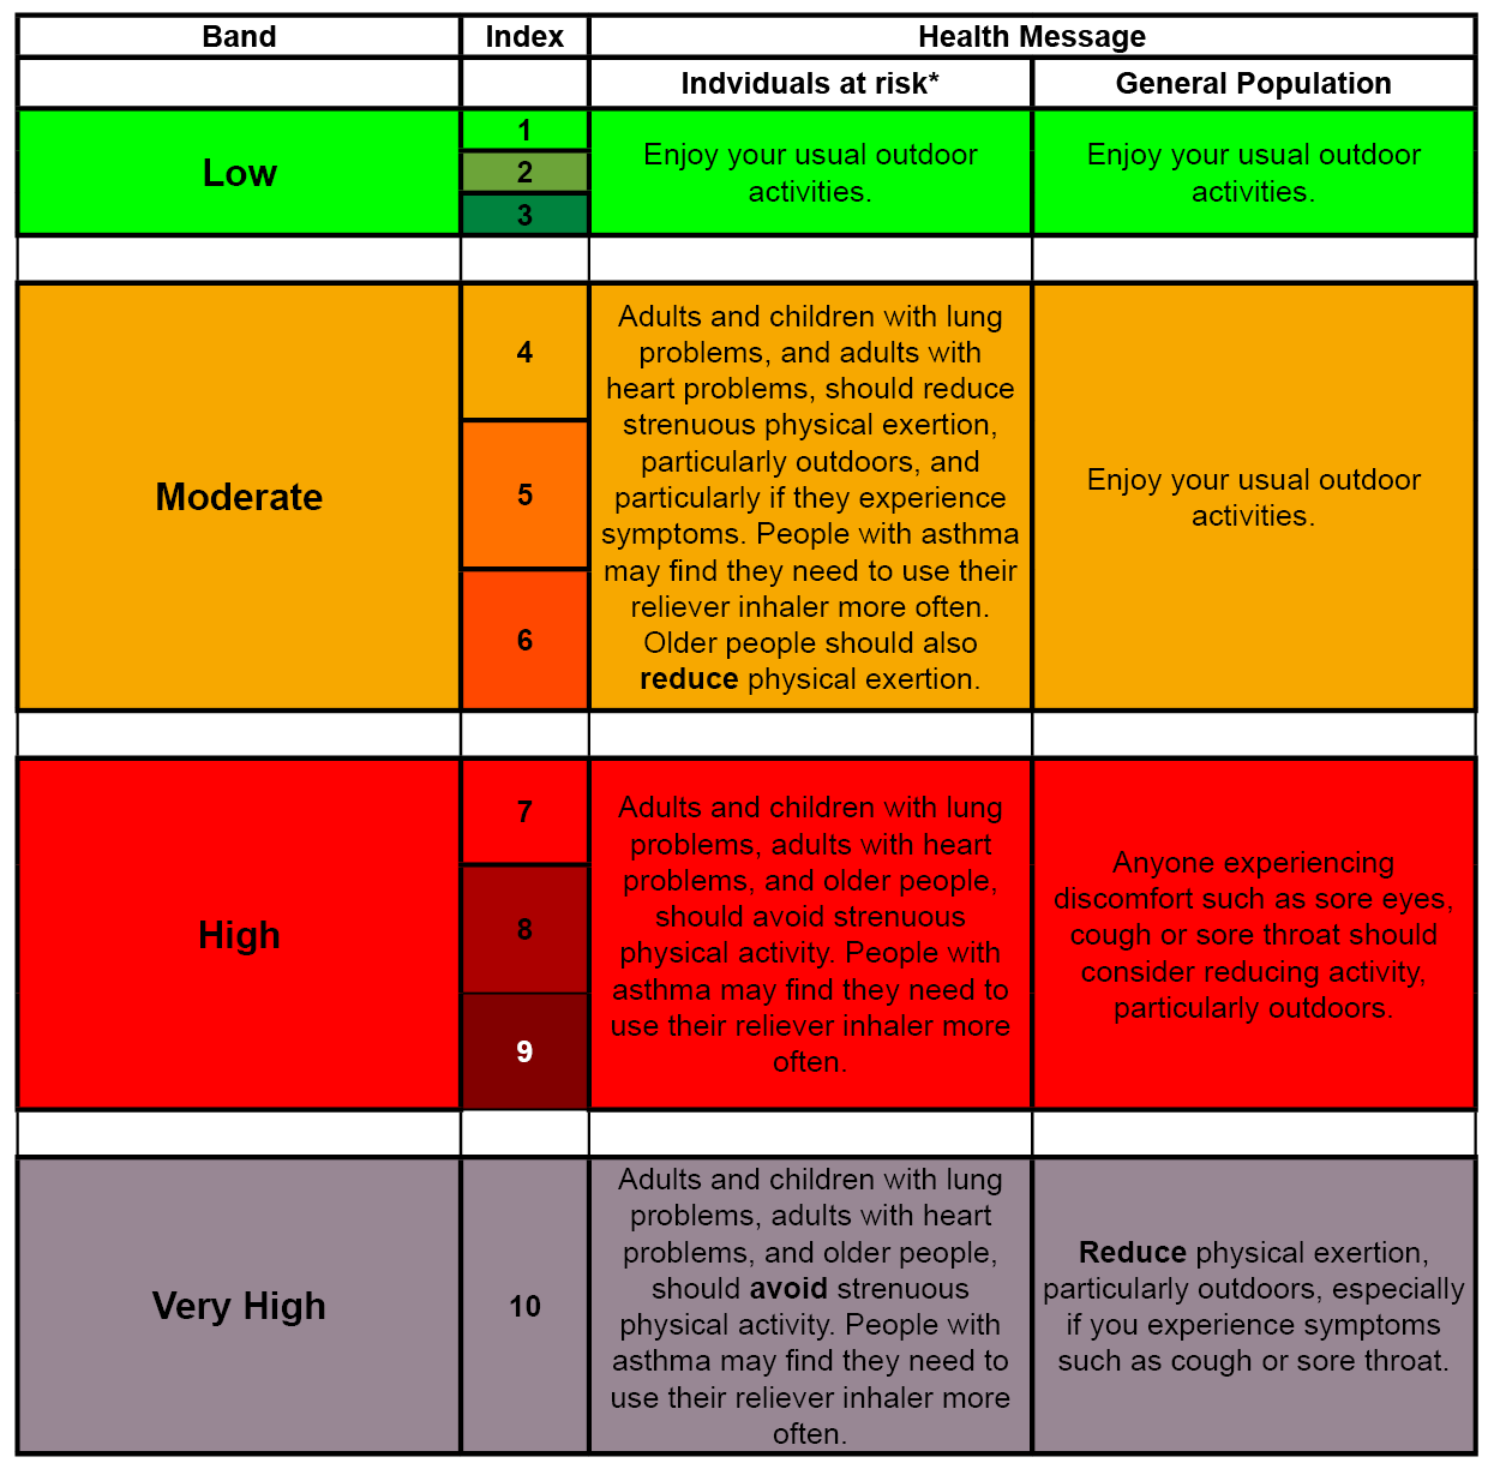
In the UK, most air pollution information services rely on the Daily Air Quality Index (DAQI) and a four-band system approved by the Committee on Medical Effects of Air Pollutants (COMEAP). This system utilises a scale ranging from 1 to 10 to measure the levels of various pollutants. Air pollution is categorised into four bands:
- Low: (1-3)
- Moderate: (4-6)
- High: (7-9)
- Very High: (10)
The categories provide an easy-to-understand way of interpreting the AQI score and allow individuals to act appropriately to protect their health. For example, when the AQI is in the Unhealthy for Sensitive Groups category, people with respiratory conditions such as asthma may need extra precautions to protect their health.
Why should we use the Daily Air Quality Index (DAQI)?
The DAQI is a crucial tool for managing air quality, as it provides information about the level of air pollution in a given area. Governments and businesses can use the data to develop policies and strategies to reduce air pollution and for individuals to make informed decisions about their health and well-being. For example, if the DAQI is high in a particular area, individuals may choose to avoid outdoor activities or wear a mask to protect themselves from the harmful effects of air pollution.
In addition to providing information about air quality, the DAQI can raise awareness about the importance of clean air. By highlighting the level of air pollution in a particular area, the DAQI can encourage individuals and businesses to reduce their environmental impact and improve air quality. This could include reducing car use, using public transport, or investing in renewable energy.
The flaws with the Daily Air Quality Index (DAQI)
Relying solely on data collected from reference stations is inadequate to validate the decision-making process for implementing a clean air project. When we consider that the data from a reference station is obtained from a single capture point, it becomes clear that it is insufficient to identify real-life events throughout the entire area. Consequently, there is a risk of pollution hotspots going unrecognised. Congestion on busy roads, manufacturing sites near schools, and high levels of domestic burning in rural villages are some real-life events that can affect the air quality in vulnerable locations. To keep up to date with the constant air quality fluctuations, new technology systems are needed to provide a deeper understanding of our air quality and improve the daily air quality index status quo.
The solution
By incorporating additional data from solutions such as hyperlocal sensors, we can construct a more robust evidence base platform, enabling us to make better-informed decisions regarding our interventions. More data, in turn, will hopefully lead to greater success in achieving cleaner air.
The Vortex air quality portal provides a seamless solution for clients to calculate air quality in a particular location and source apportionment to identify where pollution occurs. This gives local authorities a more granular platform to take action on their clean air intervention using real-time data to take a targeted approach to achieving cleaner air. By utilising DEFRA's Air Quality Index, which is colour coded to our sensors, clients can quickly determine whether the air quality is good, moderate or poor. If the air quality is poor, clients can take rapid action to improve air quality and raise public awareness about the potential health risks in that area. This tool promotes a cleaner and healthier environment, enabling individuals and organisations to make informed decisions and positively impact the air we breathe.
In conclusion, the Air Quality Index (AQI) is an essential tool for understanding air quality and the impact of air pollution on public health.
For more information on air quality monitoring, contact us here: https://vortexiot.com/contact
More blogs
Should clean air be a national priority?
Millions across the UK are still exposed to harmful levels of air pollution every day. As we mark Clean Air Day, it’s time to ask: if clean air impacts our health, our…
Engaging communities for cleaner air
As we mark Clean Air Day, we proudly highlight the significance of engagement and behaviour change to make a tangible difference in the fight against air pollution.