Leveraging hyperlocal air quality data for School Streets
Discover how hyperlocal air quality data can be used to improve air quality on school streets
Scott Sutton - 20 March 2024

Understanding the importance of School Streets
In recent years, the concept of School Streets has gained momentum as a proactive measure to ensure the safety and well-being of children around educational institutions. For example, in London alone, the number of schools participating in School Streets schemes has grown from less than 90 in 2019 to over 500 by 2022.
These initiatives temporarily restrict vehicular traffic around schools during drop-off and pick-up times, promoting active travel and significantly reducing pollution levels in the immediate vicinity. They are usually enforced either by automatic number plate recognition cameras (ANPR) or physical barriers such as collapsible bollards, turtle gates and volunteers.
However, the effectiveness of School Streets relies heavily on accurate data and informed decision-making. Among the various metrics that need consideration, air quality stands out as a critical factor affecting the health and concentration of young learners.
The role of hyperlocal air quality data
While traditional air quality monitoring methods provide valuable insights, the presentation of hyperlocal data plays a pivotal role in validating the success of School Street schemes and pinpointing areas that require attention.
Hyperlocal air quality data refers to real-time or near-real-time measurements from monitors strategically placed on streets in local neighbourhoods, towns and cities.
Unlike conventional monitoring stations, which may be located kilometres away, these monitors offer granular insights into pollution levels precisely where children spend a significant portion of their day.
By visualising this data effectively, local authorities can accomplish two crucial objectives:
- Identifying areas for potential expansion or improvement
- Validating the impact of existing School Street schemes
Identifying areas for improvement
Secondly, hyperlocal data visualisation is a diagnostic tool for identifying specific areas within School Street zones that require targeted interventions. By mapping pollution hotspots and correlating them with factors such as traffic flow patterns and infrastructure deficiencies, authorities can prioritise remedial actions to enhance air quality further.
Imagine a scenario where a local council, eager to assess the impact air pollution is having around School neighbourhoods, and integrates hyperlocal air quality monitoring into their approach. Through intuitive visualisations accessible to policymakers and the public, the council can potentially see compelling evidence showcasing significant increases in pollution levels, noticeably NO2, during peak school times because of busy through-traffic.
Buoyed by this reception, the council can embark on a data-driven journey to identify areas for further improvement. With hyperlocal monitors strategically deployed across school zones, real-time monitoring reveals nuances in air quality dynamics, prompting targeted interventions such as green spaces, further school streets, pedestrian infrastructure upgrades and advocacy for sustainable transportation alternatives.
Validating success with hyperlocal data
Secondly, presenting hyperlocal air quality data allows stakeholders to assess the tangible benefits of School Streets with empirical evidence. For instance, data collected from air quality monitors has revealed up to 40% reductions in nitrogen dioxide (NO2) levels during School Street hours compared to baseline levels.
However, a crucial stage often left out is the installation of hyperlocal air quality monitors before School Streets enforcement. Installing it beforehand can effectively capture a comprehensive dataset that serves as a baseline for comparison. This bulk of data collected from pre-restricted traffic provides invaluable insights into existing pollution levels, allowing for a thorough analysis of the impact of School Streets measures once enforced. Comparing pre- and post-closure data enables authorities to quantify the differences in air quality precisely, pinpoint pollution hotspots, and accurately validate the success of interventions.
Ultimately, placing air quality monitors before the enforcement of School Streets is not just about data collection—it's about laying the groundwork for meaningful change and fostering healthier, more sustainable environments for our children to thrive in. Research has shown that increased physical activity resulting from active travel to school can lead to better cardiovascular health.
This validation reinforces public support for existing schemes and encourages further investment in similar initiatives across other school zones.
Conclusion
School Streets have encouraged more children and parents to choose active modes of transportation, such as walking or cycling, to travel to and from school. Surveys conducted among parents and students have indicated a significant increase in active travel rates, promoting physical activity and reducing reliance on motor vehicles.
The presentation of hyperlocal air quality data emerges as a linchpin in the success of School Street initiatives, providing the empirical foundation for informed decision-making and community engagement.
More blogs
Should clean air be a national priority?
Millions across the UK are still exposed to harmful levels of air pollution every day. As we mark Clean Air Day, it’s time to ask: if clean air impacts our health, our…
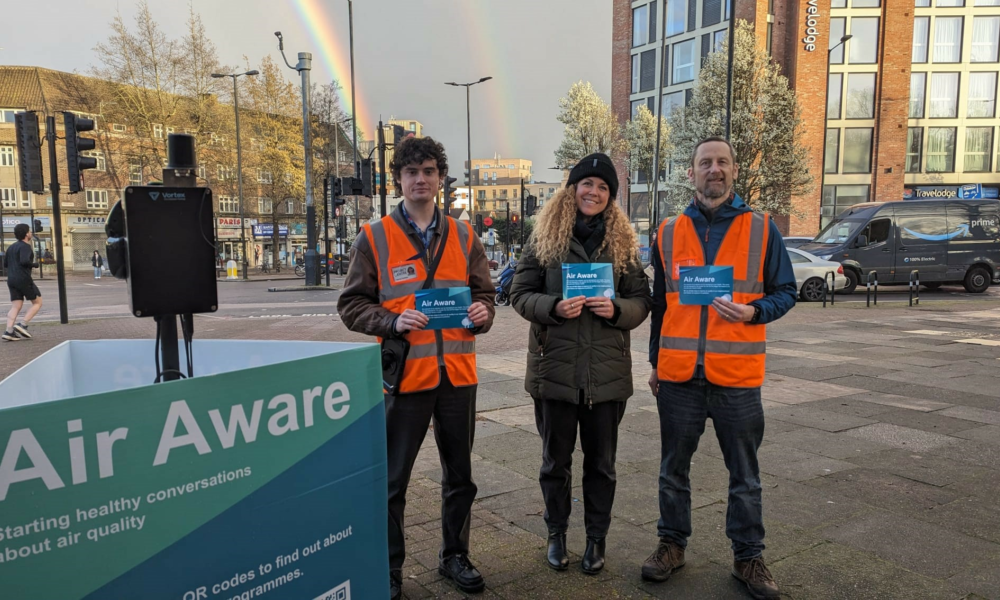
Engaging communities for cleaner air
As we mark Clean Air Day, we proudly highlight the significance of engagement and behaviour change to make a tangible difference in the fight against air pollution.