Going beyond compliance: Doing more with your air quality monitoring data?
The problem with the current UK's air quality monitoring network
Harley Paffit - 9 March 2023

Overview of UK's air quality monitoring network
Air Quality Standards (AQS) are legally binding limits for different pollutants and are set to protect members of the public, including the most vulnerable, from excessive pollution levels. There are no global legally enforceable AQSs, and the UK AQSs are less stringent than the corresponding, non-binding World Health Organization (WHO) guidelines.
Most air quality monitors across the UK are in place to assess compliance with the UK AQS. Focusing air quality management solely on compliance is problematic for several reasons. For one, air quality monitoring data in the UK is often manipulated solely to compare to the UK’s annual average AQSs. Annual average AQSs provide a useful metric to describe the average exposure to a pollutant over a year at one location. However, huge amounts of information are lost by providing a single number to describe air quality at one location over a year. For example, a real-time monitor taking readings every fifteen minutes will produce 35,040 in a year. By simply averaging these measurements, insight into when pollution peaks and when exposed to air pollution might be greatest is lost.
Secondly, as the UK’s air quality monitoring network is designed around assessing compliance with legal limits, the network focuses on areas of the poorest air quality and is not evenly spread. Emissions from road traffic have traditionally been the principal cause of non-compliance across much of the UK. However, as exhaust emissions from road traffic have decreased due to tighter emission standards and the roll-out of electric vehicles, air quality is improving and thus the area where monitoring is taking place is shrinking.
Finally, focusing on compliance can give the illusion that air quality in a compliant location is good and safe. Despite differences in AQSs worldwide, there is a consensus that there are no safe levels of certain pollutants and as such, exposure to air pollution should be minimised.
How to go beyond compliance?
To go beyond compliance and make meaningful reductions in exposure to air pollution, local authorities and other stakeholders must understand what contributes to poor air quality locally. This is not always a straightforward task, as air quality is not simply influenced by total emissions, with the weather also playing an important role. High emissions during a period of ‘good’ weather can result in good air quality, and low emissions during periods of gentle winds (i.e. conditions not conducive to effective dispersion) can result in a build-up of pollution and poor air quality.
To identify the key sources of air quality, air quality measurements must be compared to and combined with other data sources such as traffic and meteorology. Vortex’s hyperlocal, VTX air quality monitor can measure particulate matter (PM10 & PM2.5), gaseous pollutants including NO, CO2, NO2, O3 and SO2, as well as environmental parameters such as relative humidity and temperature. Furthermore, Vortex’s sister company, Videalert, installs CCTV traffic cameras to support interventions such as clean air zones and low-traffic neighbourhoods and can provide traffic data (including vehicle fuel category, CO2 band & vehicle type) which can be integrated with the outputs of VTX’s air quality monitor.
It is through the combination of localised air quality data and other sources such as traffic and meteorology that the greatest insight can be achieved. The next section outlines some insights that can be gained from combining data sources.
Air Quality Measurements and Meteorology
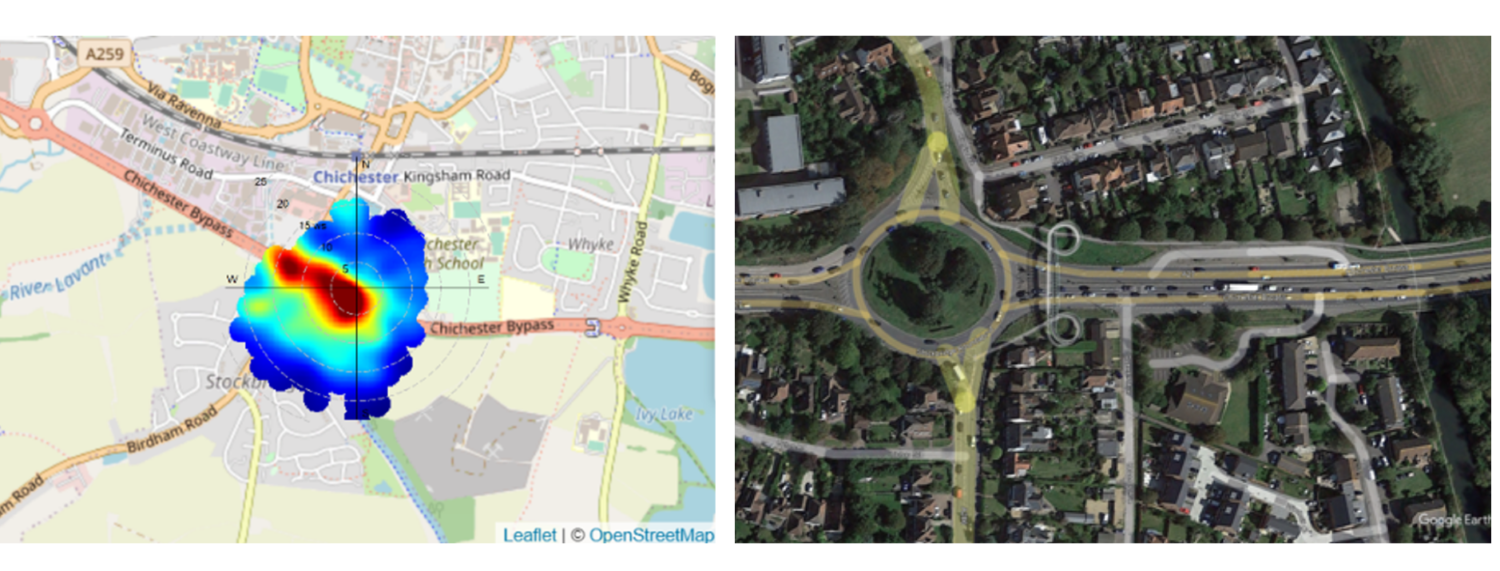
Figure 1 demonstrates that the highest concentrations were recorded at the Chichester A27 Bypass monitor when winds were light or from the northwest (in the direction of the Stockbridge roundabout). Emissions at this junction are likely far higher than a free-flowing section of this same road due to the combined effect of congestion and increased acceleration and deceleration of vehicles.
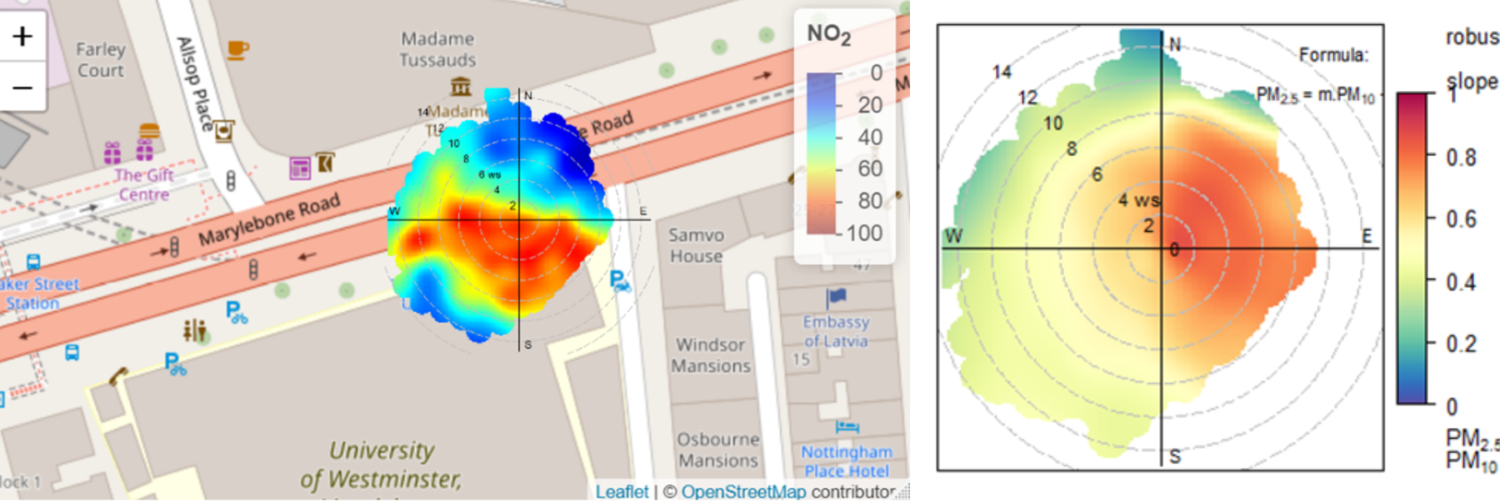
Figure 2 (left) demonstrates that the Marylebone monitor in London experiences the highest concentrations when the wind is from the south. This is despite the monitor being located on the south side of the road (upwind of Marylebone Road). Marylebone Road at this location has tall, unbroken buildings on either side of the road, and pollution struggles to escape. This pattern proves that pollutants are recirculating in this “street canyon” environment. This effect and associated elevated concentrations can also be caused by temporary structures such as construction hoardings or trees.
The ratio of pollutants from road traffic differs from domestic sources, and the shipping industry. By calculating the ratio of two pollutants (e.g. NO2 and SO2) and investigating how this ratio changes with wind speed and direction, further insight into the sources of pollution can be provided. Figure 2 (right) describes how the ratio of PM2.5
to PM10 differs by wind direction. It shows that when winds are from the east, almost all PM10 is in the form of PM2.5 (a ratio of 1), whilst winds from the west have a lower PM10 to PM2.5
ratio. This indicates at least two different sources of PM at this site. Previous research has identified that easterly winds often carry polluted air from Europe to the UK, resulting in high concentrations of PM2.5.
Traffic data and Emissions Estimates
Air quality measurements are not always available; however, insight into sources of pollution may still be required. In this situation, air pollution concentrations can be predicted, as part of air quality assessments, using physics-based air dispersion models such as ADMS-Roads. Dispersion models do, however, need to be verified (checked to be working appropriately) against existing data sources and so cannot always be used.
Automatic Number Plate Recognition (ANPR) systems can be used to estimate the age and emission profile of the vehicle fleet, also engine type (petrol, diesel, electric) in an area or on a particular road, which can be a quick means to identify the greatest contributors to local air pollution, without even measuring air quality.
Vortex and our sister brands offer a complete end-end solution for clean air interventions, starting with engagement programmes and early measurement of hyperlocal air quality readings to implementing the intervention with traffic management cameras and back office support for enforcement.
Working across the Marston Holdings group, the company supported the award-winning traffic congestion and pollution reduction scheme with the London Borough of Hammersmith and Fulham. Using the VTX Air sensors, the outcome of the first initial phase saw significant environmental improvements, with a 50% improvement in air quality and a one-tonne per day carbon reduction during the first trial phase.
Following a successful trial of the South Fulham clean air neighbourhood, launched in December 2021, covering local roads to the east of the Wandsworth Bridge Road, the London Borough of Hammersmith & Fulham extended the trial in December 2022 to include the local roads to the west of Wandsworth Bridge Road and south of the New King’s Road.
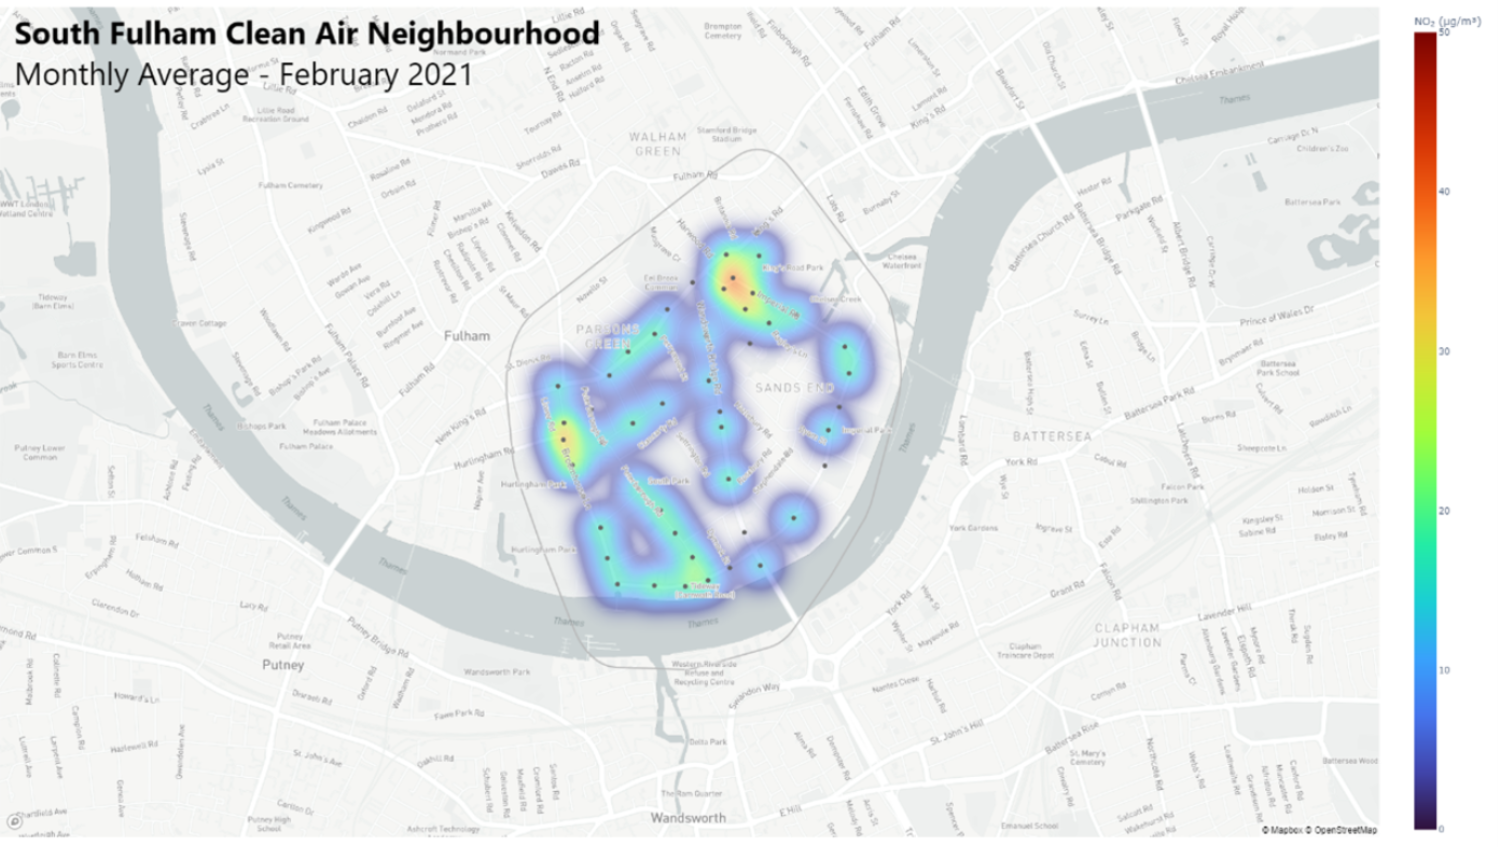
The trial aims to improve air quality by reducing traffic and congestion and discouraging out-of-borough motorists from using residential streets as cut-throughs between the major roads through the automatic issuing of penalty charge notices and uses strategically placed traffic cameras (red markers) to provide enforcement without restricting access for residents.
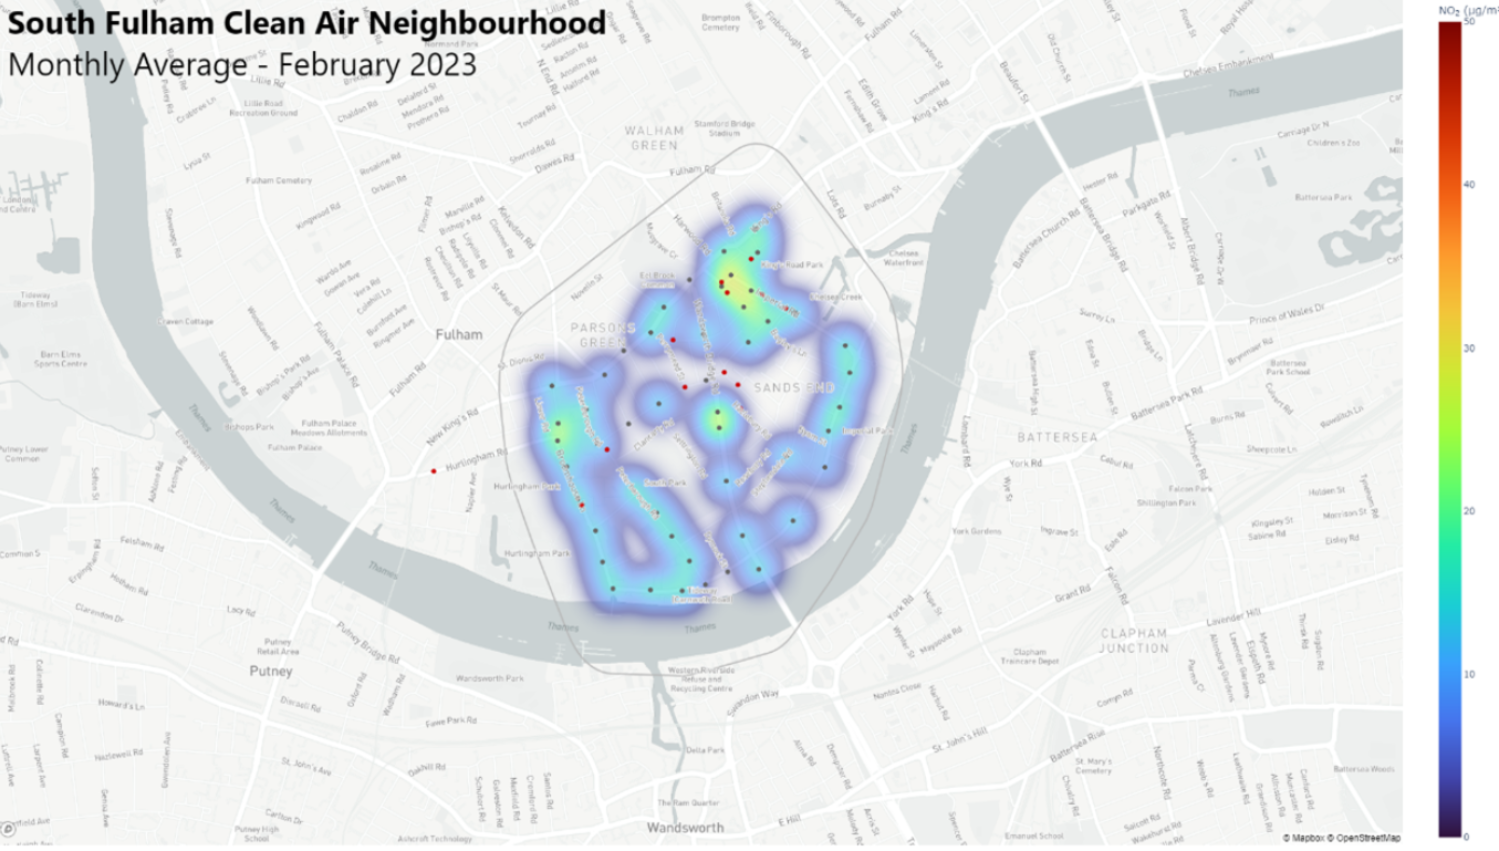
Figure 3 and 4 (below) shows the reduction in monthly average NO2 concentration gathered by VTX Air devices (black markers) back in 2021 and clearly shows the reduction in the average monthly concentrations for NO2 pollutants both before (Feb ‘21) and after (Feb ‘23) the launch of the South Fulham clean air neighbourhood.
Combining All Data Sources: Machine Learning and Artificial Intelligence.
At the start of the first Covid-19 lockdown in March 2020, air pollution at many locations across the UK increased, despite a reduction in economic activity and traffic movements. Was the increase caused by greater domestic emissions? Or perhaps a change in atmospheric chemistry?
Artificial Intelligence (AI) can be used to precisely learn how precipitation, wind speed, wind direction, humidity and other factors influence measured concentrations. The same AI can then be used to predict the concentration if every day has the same weather (and different emissions or traffic flows). By ‘deweathering’ an air quality time series, clear changes can be identified. Although pollution concentrations increased at the onset of the first lockdown, the AI demonstrated that weather conditions had masked a dramatic decrease in emissions at most monitoring locations across the country. The observed increase was, in fact, caused by transboundary pollution from northern Europe, carried to the UK on an uncommon easterly wind. If the weather had been ‘normal’, pollution concentrations would have fallen dramatically.
Summary
Air quality management in the UK largely focuses on achieving compliance with the AQSs. This significantly affects where air quality is monitored and how the measurements are analysed and presented. This narrow-minded focus on compliance is causing the network to shrink as air quality improves and a loss of useful data.
The health and well-being of members of the public can be greatly enhanced if stakeholders involved in air quality management can go beyond compliance, by monitoring in areas where air pollution levels are below the AQSs and by interrogating air quality measurements in combination with other sources of data.
This post provides examples of techniques and methods which can be applied to air quality and emissions datasets. Whilst no analytical technique is perfect, insight into the sources of pollution and ways to minimise exposure can be identified with little extra effort, and often freely available data. The latent potential of combining existing and freely available data sources in the field of air quality management is significant. As more data streams come online, the challenge for industry and local authorities will be on how best to integrate this data to provide insight in real-time.
Author: Harley Parfitt, Greenavon Air Quality Consultants
About the Author
Harley Parfitt runs Greenavon, an air quality consultancy that specialises in providing air quality assessments, including indoor air quality assessments, for planning applications across the UK. For more information, visit Greenavon.com.
More insights

Designing a sustainable IoT network for remote air quality monitoring
This insight presents the remarkable findings and challenges encountered while deploying an Internet of Things (IoT) wireless sensor network for air quality monitoring in…

Why the future is hyperlocal - The need for local air quality data
Hyperlocal, high-density deployments of air quality monitors can identify sources and events that contribute to air pollution spikes, providing valuable data to inform…