Why the future is hyperlocal - The need for local air quality data
Hyperlocal, high-density deployments of air quality monitors can identify sources and events that contribute to air pollution spikes, providing valuable data to inform street-level decisions and local air pollution improvement actions.
John Vinson - 7 February 2022

Air pollution is a ubiquitous problem.
The WHO estimates that ambient air pollution accounts for an estimated 4.2 million deaths per year due to stroke, heart disease, lung cancer, and acute and chronic respiratory diseases. Air quality has never appeared on an official UK death certificate until the case of Ella Kissi-Debrah, when in December 2020 Southwark Coroner’s Court found that air pollution made a ‘material contribution’ to her death.
Around 99% of the world’s population live in places where air quality levels exceed WHO limits and it affects developed and developing countries alike.
In reviewing its Air Quality Guidelines (AQG's) for the pollutants PM2.5, PM10, ozone, nitrogen dioxide, sulphur dioxide and carbon monoxide, with the exception of sulphur dioxide, WHO reduced them all from the previous 2005 guidelines. It also stated that there “was no safe level of air pollution, and these AQGs should be seen as guidelines on a route to zero”.
Why current measurement techniques aren’t enough anymore
In the UK, there are currently two widely adopted methods of monitoring air quality, Reference Stations and Diffusion Tubes. Both reference stations, such as the DEFRA Automatic Urban & Rural Network (AURN), local Air Quality Monitoring Stations (AQMSs), and diffusion tubes, for NO2, are recognised by regulation.
AURNs offer a high degree of accuracy but are expensive to purchase and operate, requiring regular maintenance and servicing, and because of their low deployment numbers, give very poor spatial resolution. i.e., there are typically only one or two of these station types per town or city area.
Diffusion tubes, on the other hand, are cheap and small. They are often deployed in greater numbers to give good spatial resolution across an area, and are accurate, but because they provide an average reading over a long period (a month or several weeks) they give limited temporal resolution, only measure NO2 and have a larger carbon impact as they require site visits to change and transport to the laboratory. The AURN is regularly situated in a different location and can record different pollution conditions to the tube.
A number of factors including topography, meteorological, natural, and anthropological can determine the air quality trends of a location. There can be spatial variation in air quality data within minute ranges - air quality is dynamic. Appropriate small form sensors can be utilised to fill the gap between reference stations and diffusion tubes. These can offer both improved spatial and temporal capability. This allows for greater data capture and local insight into pollution levels, causes and events which is not possible with reference stations and diffusion tubes alone. The price point of some of the emerging small form sensors means that they can now be deployed at an increased density than previously possible, more data equals greater insight.
What do we mean by the term "hyperlocal"?
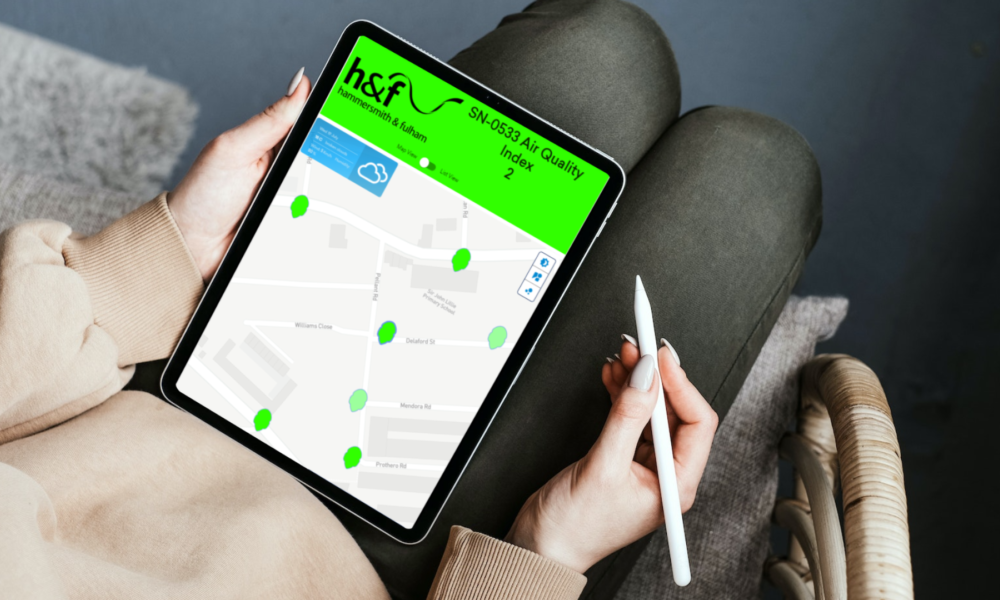
There is no standard definition of hyperlocal but in the context of air quality monitoring, it is taken to be at a street-level density that allows you to see a greater granularity of information, allowing the understanding of local influences and levels of air pollution. Obviously, the denser the network the more granular the data will be and in the case of Hammersmith & Fulham, they have a deployment of 62 units within an area of ½ square mile, with a sensor every few hundred meters, with plans to grow the network to over 500 sensors covering the whole borough at a similar density.
Why hyperlocal is important
Previously the majority of interventions to tackle air quality, especially NO2 have been broad approaches, based on modelling and published vehicle emission data. For example, rolling out Clean Air Zones (CAZs) or blocking vehicle access to residential streets to prevent rat runs. Whilst these have been in many cases very successful in reducing air quality issues, they are, as previously stated, a very blanket tool that targets a class of vehicle or all vehicles entering a street and can have unintended consequences, such as disproportionately affecting different income classes or access for emergency vehicles for example. Hyperlocal data based on real-time emissions allows different approaches to be taken and their impact assessed.
Knowing at a local level the background level of air pollution, sources of pollution (local, point source, out of area etc.) and apportionment of sources enables the data to be combined with other data sources such as traffic flows to provide greater insight to aid decision making. Collecting baseline data and knowing and understanding local air pollution means the planning and likely success of any interventions can be better predicted and allow for more accurate post-intervention assessment and hence determine the return on investment (ROI). For example, how do you know that local pollution levels are not associated with pollution migrating in from elsewhere? How do you know the effect of any interventions on nearby areas? Is the problem just being moved? Do you understand the contributions from log burners, central heating, or even tree-lined streets – that can contribute to increased ozone due to emitted volatile organic compounds (VOCs) in certain weather conditions? Are there other point sources that you need to be aware of such as construction sites, bus depots or crematoria, for example?
Vortex’s recent hyper-local deployment in Hammersmith and Fulham illustrates the power of hyperlocal monitoring. In south Fulham, the initial high-density deployment of air quality sensors has shown valuable information and allowed the impacts of interventions on traffic to be more accurately understood, as well as identify previously unseen pollution events. The nearest reference station is 2 miles away from this area and is unable to pick up these local events.
Events identified included:
- A frequent PM event at 02:00 in the morning, at one location, identified as night deliveries to a construction site
- The effect of log burners and gas boiler during cold nights with very low traffic during lockdown
- Effects on ozone and NO2 concentrations on tree-lined streets during rapid daytime temperature increases
- Effect of introducing a camera enforced low traffic neighbourhood on air pollution and the effects on neighbouring areas
The future
The WHO has already stated that any air pollution can have an effect on human health and that the current Air Quality Guidelines (AQGs) should only be seen as a stepping stone on the route to zero. As legislative standards get tighter and tighter in the coming years, then it will become essential to fully understand the causes and apportionment of pollution sources if we are ever able to make the correct type of interventions. The longer that we collect base data on air pollution, the more informed we will be when it comes to making the next set of interventions and determining their effectiveness. The power of having and understanding local air pollution could lead to new ways of managing traffic, instead of the generally broad-brush approaches we use today. For example, knowing the pollution at any time of the day and combining with other data sources such as traffic information, it could become possible to develop user-specific charges, e.g. you drive a Ford Mondeo 2.0l diesel which has a known particulate output (based on DVLA information) and you want to drive into a city-centre location at a specific time, on a specific day, it will cost that user £4.75, whereas the same journey for a newer vehicle with lower particulate emissions might cost £1.10 for the same journey, just one example of how air quality data could be used in the future.
Conclusions and other thoughts
Legislation needs to catch up with the involving use and assistance that small form air sensors can contribute in the battle against air pollution. Hopefully in the near future, we will have the legislation to allow these to be used in a more regulatory methodology. That can only happen if it is also accompanied with official guidance on the suitability, use and deployment of small form sensors. Currently, there is little guidance, and it is difficult to compare sensors from different manufacturers and their performance. Hopefully, the recently published BSI standard – Air quality — Performance evaluation of air quality sensor systems will be a useful document. There is no doubt that hyperlocal air quality monitoring is essential in understanding and addressing the issues of air pollution and the sooner that we collect hyperlocal data the more effective and appropriate interventions can be. As we say at Vortex – “more data equals greater insight”.
Vortex VTX Air is a highly accurate small form sensor designed, developed and manufactured in the UK specifically to support wider roll-out of air quality monitoring. Rated excellent by Ricardo AE, it is a sim card free, maintenance-free monitor, measuring both gaseous and particulate pollutants. Operating on a thread mesh network avoids the connectivity issues associated with SIM cards and can form the communication platform for your smart city deployments with the ability to accept 3rd party sensors.
More insights

Designing a sustainable IoT network for remote air quality monitoring
This insight presents the remarkable findings and challenges encountered while deploying an Internet of Things (IoT) wireless sensor network for air quality monitoring in…
Going beyond compliance: Doing more with your air quality monitoring data?
The problem with the current UK's air quality monitoring network